
- Getting Started
- Your First Conversation
Getting Started
Your First Conversation
Discover how to ask questions, interpret responses, and iterate quickly in PlotsAlot.
Your First Conversation
With your data connected, it’s time to experience the magic of chat-driven analytics. This guide walks you through crafting questions, interpreting visual outputs, and refining follow-ups.
1. Opening a Chat
From the dashboard, click New Chat. A fresh thread appears with a friendly greeting from the assistant, inviting your first question.
2. Asking a Question
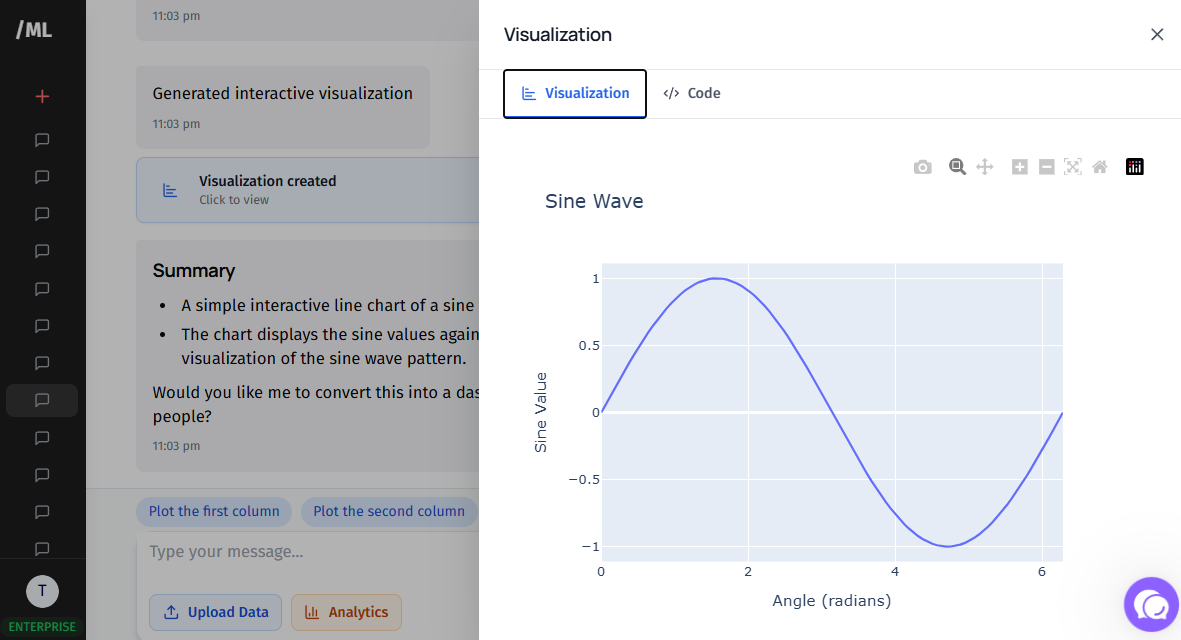
Start simple. For a sales database you could ask:
“What were total sales last month?”
The assistant analyses the underlying data and replies with both a textual summary and, when appropriate, an inline chart. The response might read:
• “Total sales for April were 125 000 USD, reflecting a 12 % increase over March.”
• A bar chart shows the previous six months for context.
Tips for Effective Prompts
• Be specific – Include time frames, product lines, or segments to narrow results.
• Ask for comparisons – E.g., “Compare mobile vs. desktop traffic last quarter.”
• Request visualisations – Use phrases like “show me a line chart of…” or “plot the top five categories.”
3. Exploring Further
The real power of PlotsAlot is its ability to remember context:
- Follow-Up Questions – After receiving the initial summary, you could ask, “Why did March dip compared to February?” The assistant will reference previous data and identify potential causes.
- Drill Down – Ask, “Break down April sales by region.” The assistant produces a new chart segmented by geography.
- What-If Scenarios – Pose hypothetical questions such as, “Assuming a 5 % increase in ad spend, how might that impact next quarter’s revenue?”
4. Interacting with Visualisations
All charts are interactive:
• Hover to see exact values.
• Click legend items to toggle lines or bars.
• Export charts as images for presentations.
5. Sharing Insights
When you discover something noteworthy, click Share. You can:
• Copy a secure link for read-only access.
• Toggle whether the chat is public to anyone with the link or restricted to invited users.
6. Saving & Organising Chats
Chats auto-save in the sidebar. You can rename them to reflect the topic, archive stale threads, or duplicate a conversation when you want to branch your analysis.
7. Collecting Feedback
Collaboration is integral. If you share the chat, collaborators can leave structured feedback directly within the thread. You’ll receive notifications and can respond inline, creating a seamless feedback loop.
8. Next Steps
Now that you know how to converse with your data, dive into deeper capabilities such as advanced visualisation and external integrations in the Guides section.